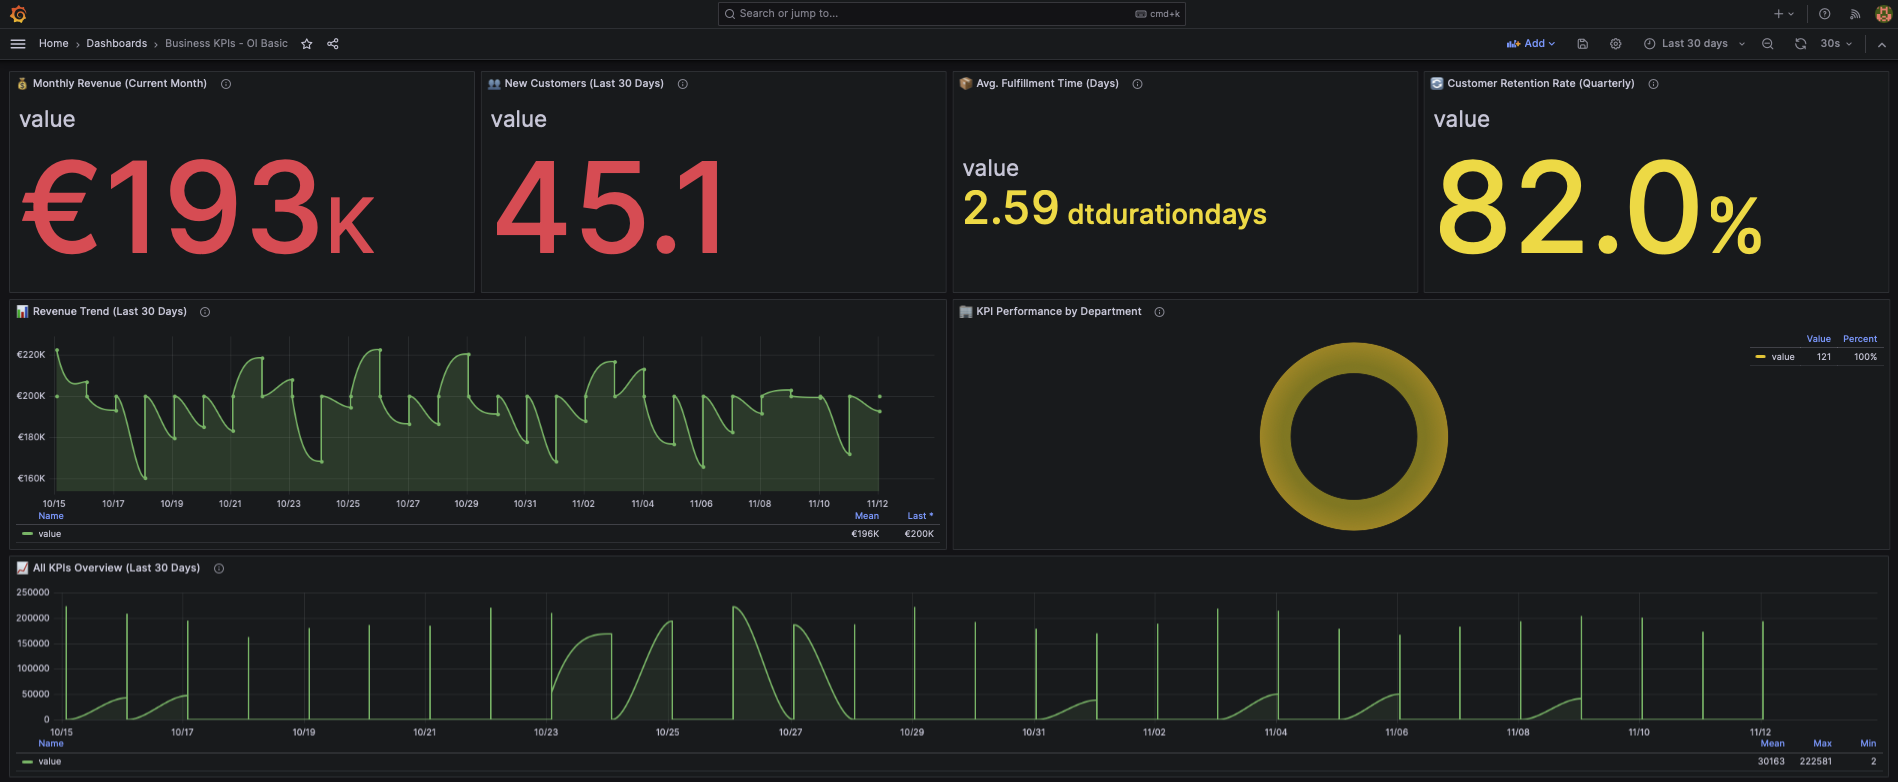
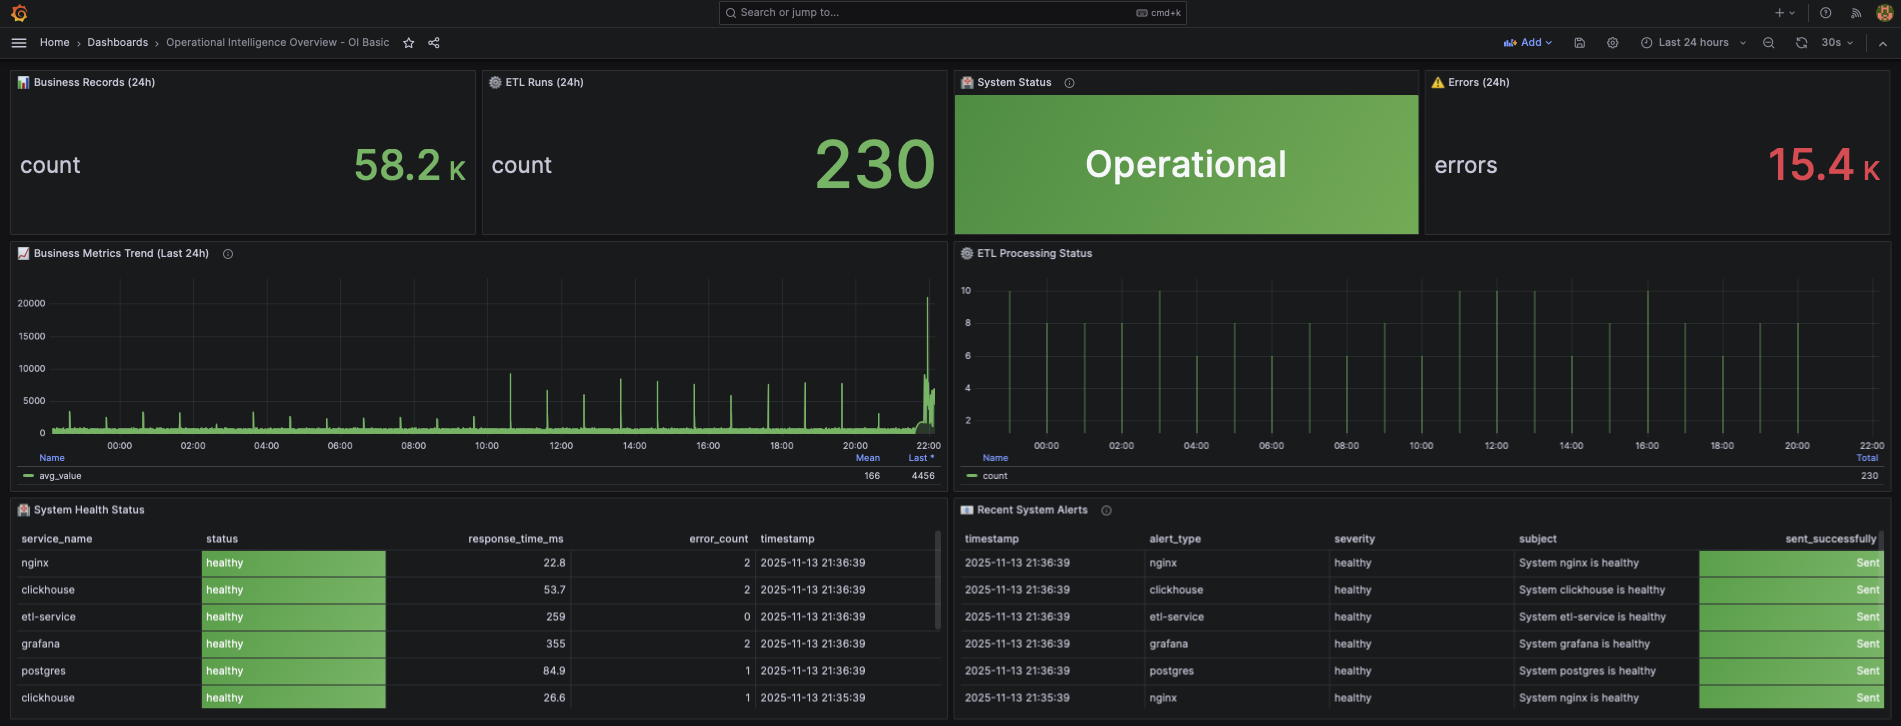
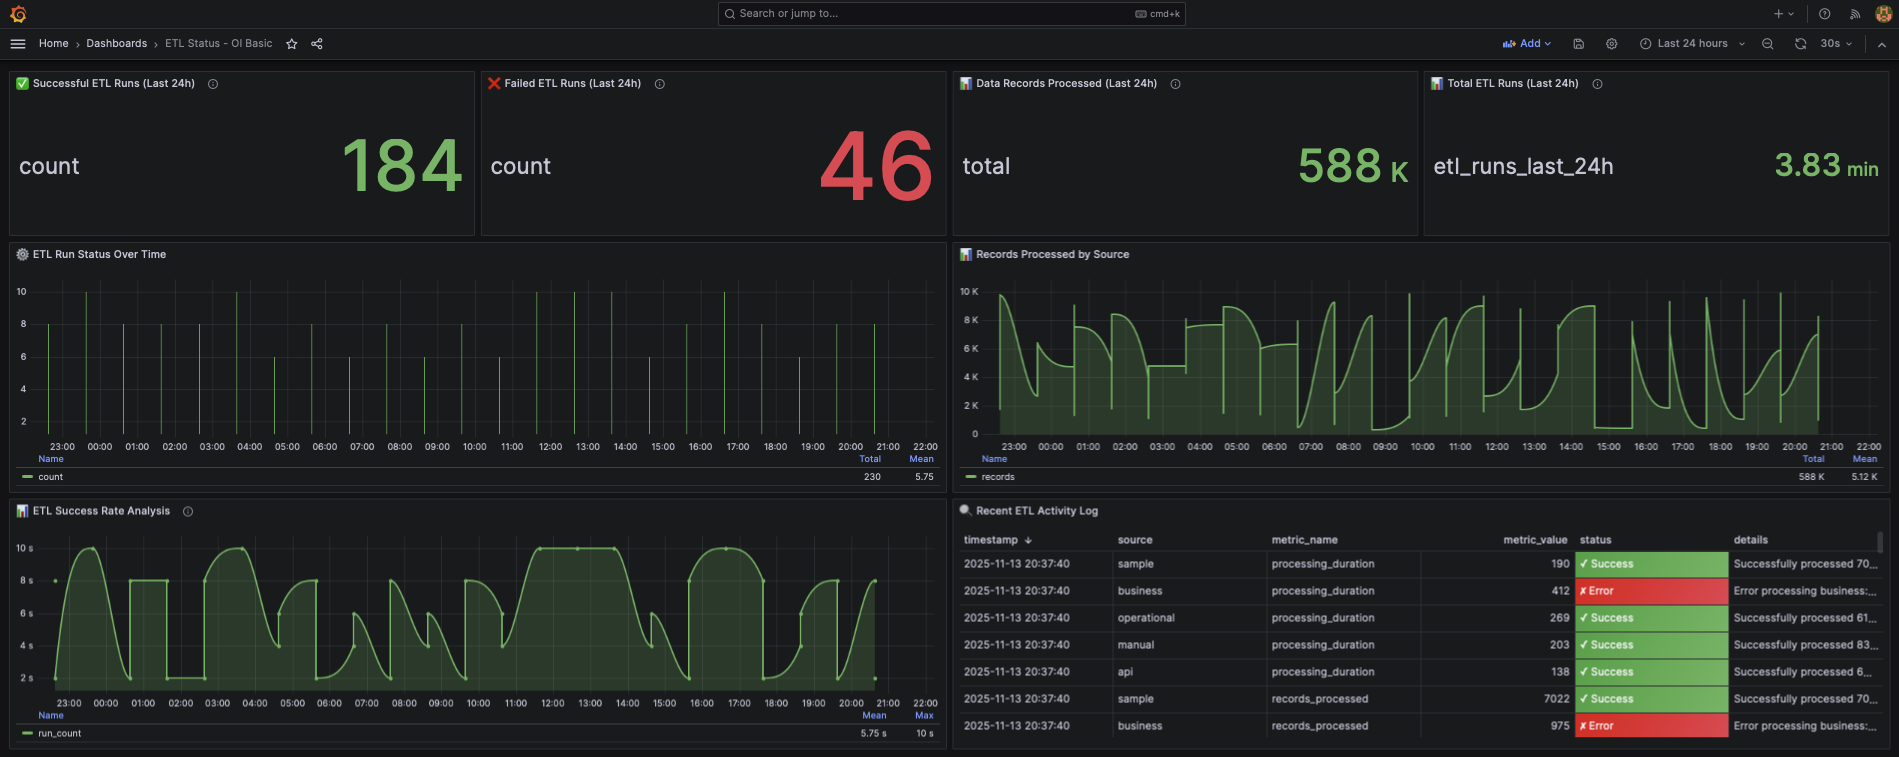
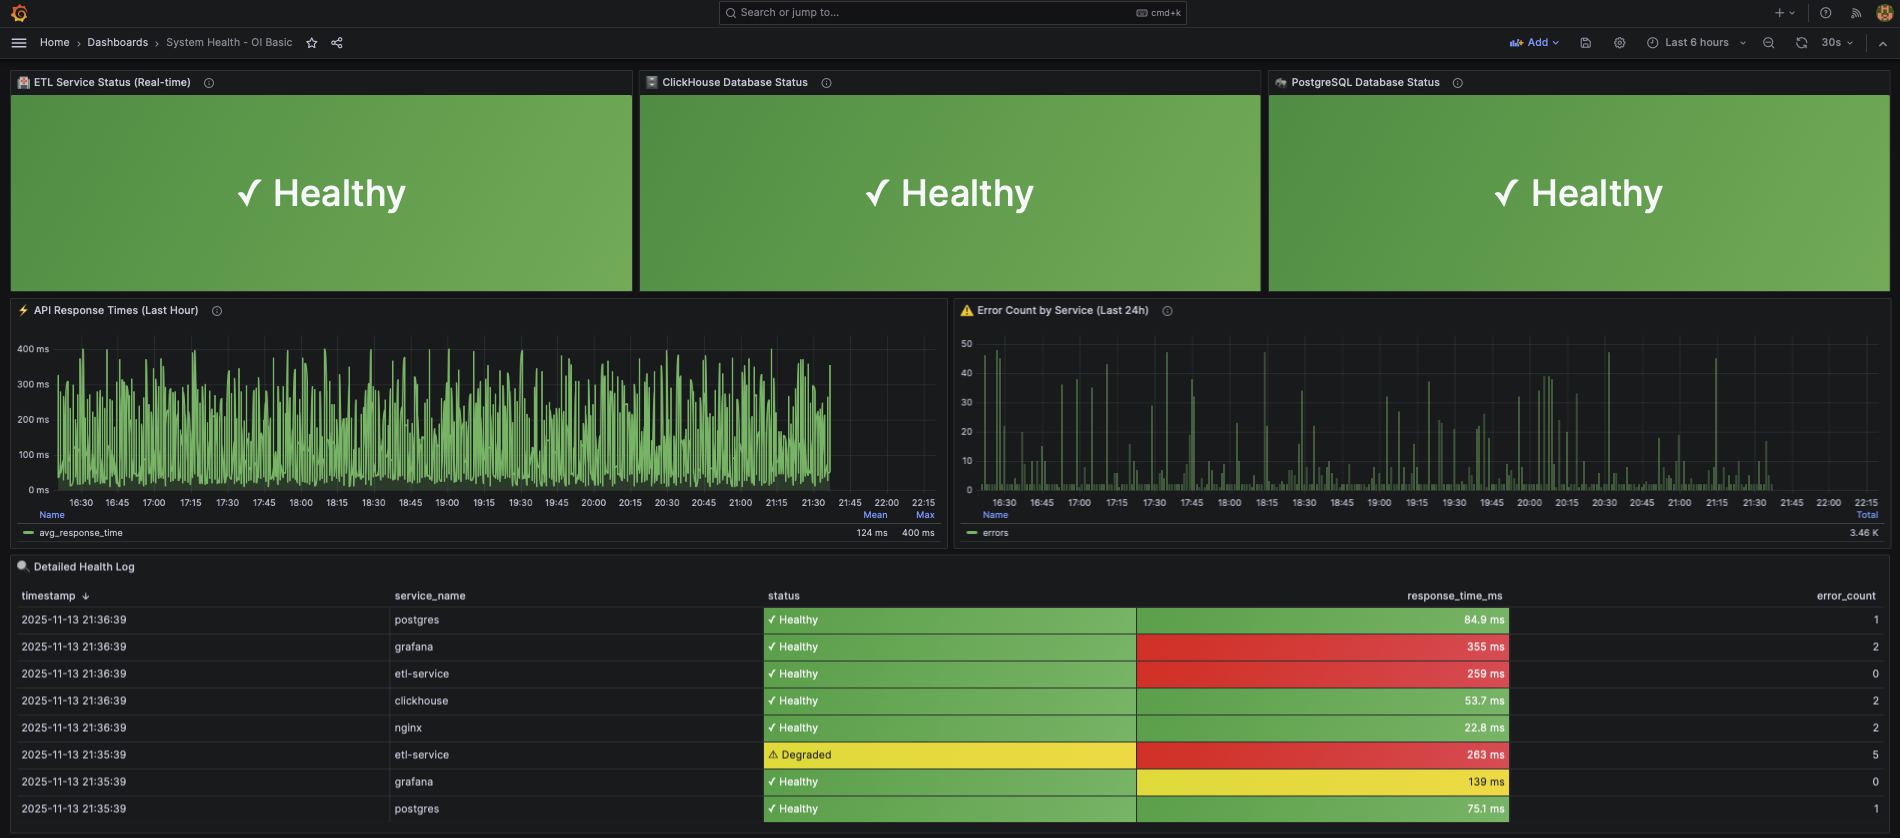
Now with AI Copilot · Powered by Google Gemini

Next Generation Intelligence

Unify your data, orchestrate pipelines and visualize KPIs — all in one modular Operational Intelligence platform. Plus an AI Copilot that turns every dashboard into a conversation: diagnosis, forecasts and next-step recommendations in real-time.

Explore AI Copilot
NeoHub Dashboard

Business KPIs

System Health

CPU 78%
Memory 65%

Powerful Features

Everything you need for operational intelligence

AI-Powered

AI Copilot

Ask your dashboards in plain language. Our AI reads live metrics, detects anomalies, forecasts trends and recommends the next action — grounded in your actual data, not guesswork.

Learn more

Unified Dashboard

Combine Business Intelligence and Observability in one powerful dashboard-system.

Modular Architecture

Through comprehensive requirements analysis and regular review meetings, we ensure precise implementation tailored to your specific needs.

Hosted Web-UI

Access your dashboards anywhere through our secure, cloud-hosted web interface.

NeoHub AI Copilot

Your 24/7 SRE & Business Analyst, Built In.

Chat with your data. Diagnose incidents in seconds. Predict where your metrics are heading next. All grounded in live ClickHouse data — no hallucinations, no guesswork.

Autonomous Diagnostics

The AI correlates metrics, logs and alerts in real-time. It points to the most likely root cause — before your on-call engineer even opens a tab.

Predictive Insights

Time-series analysis compares current behaviour against the previous period. Ask “is this getting worse?” and get a confidence-rated forecast in seconds.

Actionable Runbooks

Not just what broke, but what to do next. Prioritised, step-by-step recommendations drawn from SRE best practice — tailored to your stack.

Natural Language Analytics

No SQL, no PromQL. Just ask “write me an incident report for my boss” or “what should I prioritise in the next 30 minutes?” — and get a clear, formatted answer.

Under the hood
Google Gemini ClickHouse Live Grafana-Aware Time-Series Forecasting EU Data Residency Streaming Responses

Choose Your Level

Scale with your business needs

Every dashboard system is custom-built around your specific requirements — not off the shelf. Starting prices based on standard workloads. Final pricing adapts to your data volume, integrations and retention needs. Save 15% with an annual plan.

Basic

AI Insights
from 69 /month
€59/mo billed annually
One-time setup: from €349
3 Grafana Dashboards
CSV & REST Data Import
ClickHouse Analytics
Multi-Level Alerting
6 Months Data Retention
AI Copilot: Dashboard Q&A & Summaries

DevOps

AI Operations
from 199 /month
€169/mo billed annually
One-time setup: from €849
Everything in Web & App
Prometheus Monitoring
Loki Log Aggregation
Alertmanager & Incidents
Container Monitoring
10+ Dashboards
1 Year Log Retention
AI Copilot Pro: Autonomous Diagnostics & Runbook Generation

Want to get started at a reduced rate? Become a Pilot Customer — enjoy early access and exclusive pricing while helping us shape the platform.

Book a Free Consultation

Schedule a 30-minute discovery call to see how NeoHub.io fits your business

Dashboard Demo

Discover some example dashboards of NeoHub.io

NeoHub AI Copilot live
What should I prioritise in the next 30 minutes?
Latency trending up on website: p95 +18% vs. previous hour.

Forecast: breaches threshold in ~15 min. Confidence medium.

Runbook
  1. Inspect db-primary pool usage
  2. Consider rollback of deploy #4412
  3. Scale api-worker +2 replicas

AI Copilot in Action

Ask your dashboards anything — the AI diagnoses, forecasts and recommends the next step.

Business KPIs Dashboard

Business KPIs

Essential business metrics and key performance indicators at a glance

Operational Intelligence Overview

Operational Intelligence Overview

Comprehensive overview of all important observability metrics and KPIs

ETL Runs Dashboard

ETL Runs

Monitoring and status tracking of ETL processes

System Health Dashboard

System Health

System health monitoring and performance tracking